

Estimating the refractivity bias of Formosat-7/COSMIC-II GNSS Radio Occultation in the deep troposphere
DOI: https://doi.org/10.5194/amt-17-3605-2024
This research is the results of Pham Gia Huan under the supervisor of Professor Shu-Chih Yang and Dr. Shu-Ya Chen during his PhD study time. This research has been supported by the Taiwan National Science and Technology Council (grant nos. NSTC-111-2121-M-008-001 and NSTC-111-2111-M-008-030) and the Taiwan Space Agency (grant no. TASA-S-110316).
A brief overview:
The FORMOSAT-7/COSMIC-2 radio occultation (RO) observations demonstrate strong potential for probing the deep troposphere and delivering key insights into the Earth’s planetary boundary layer (PBL). Yet, under specific thermodynamic conditions, refractivity retrievals in the lower troposphere can exhibit significant biases. This study investigates the nature of these deep tropospheric biases and introduces statistical regression methods to estimate region-dependent refractivity errors. Findings reveal that bias characteristics differ between land and ocean. While the local spectral width (LSW) shows strong correlation with refractivity bias—making LSW-based models useful for describing its overall structure—these models struggle to capture biases in ducting layers and certain land regions. By incorporating temperature and specific humidity, the estimation model effectively accounts for large ducting-related biases. Ultimately, the minimum variance approach, which combines LSW- and temperature/humidity-based models, delivers the most accurate bias estimates.
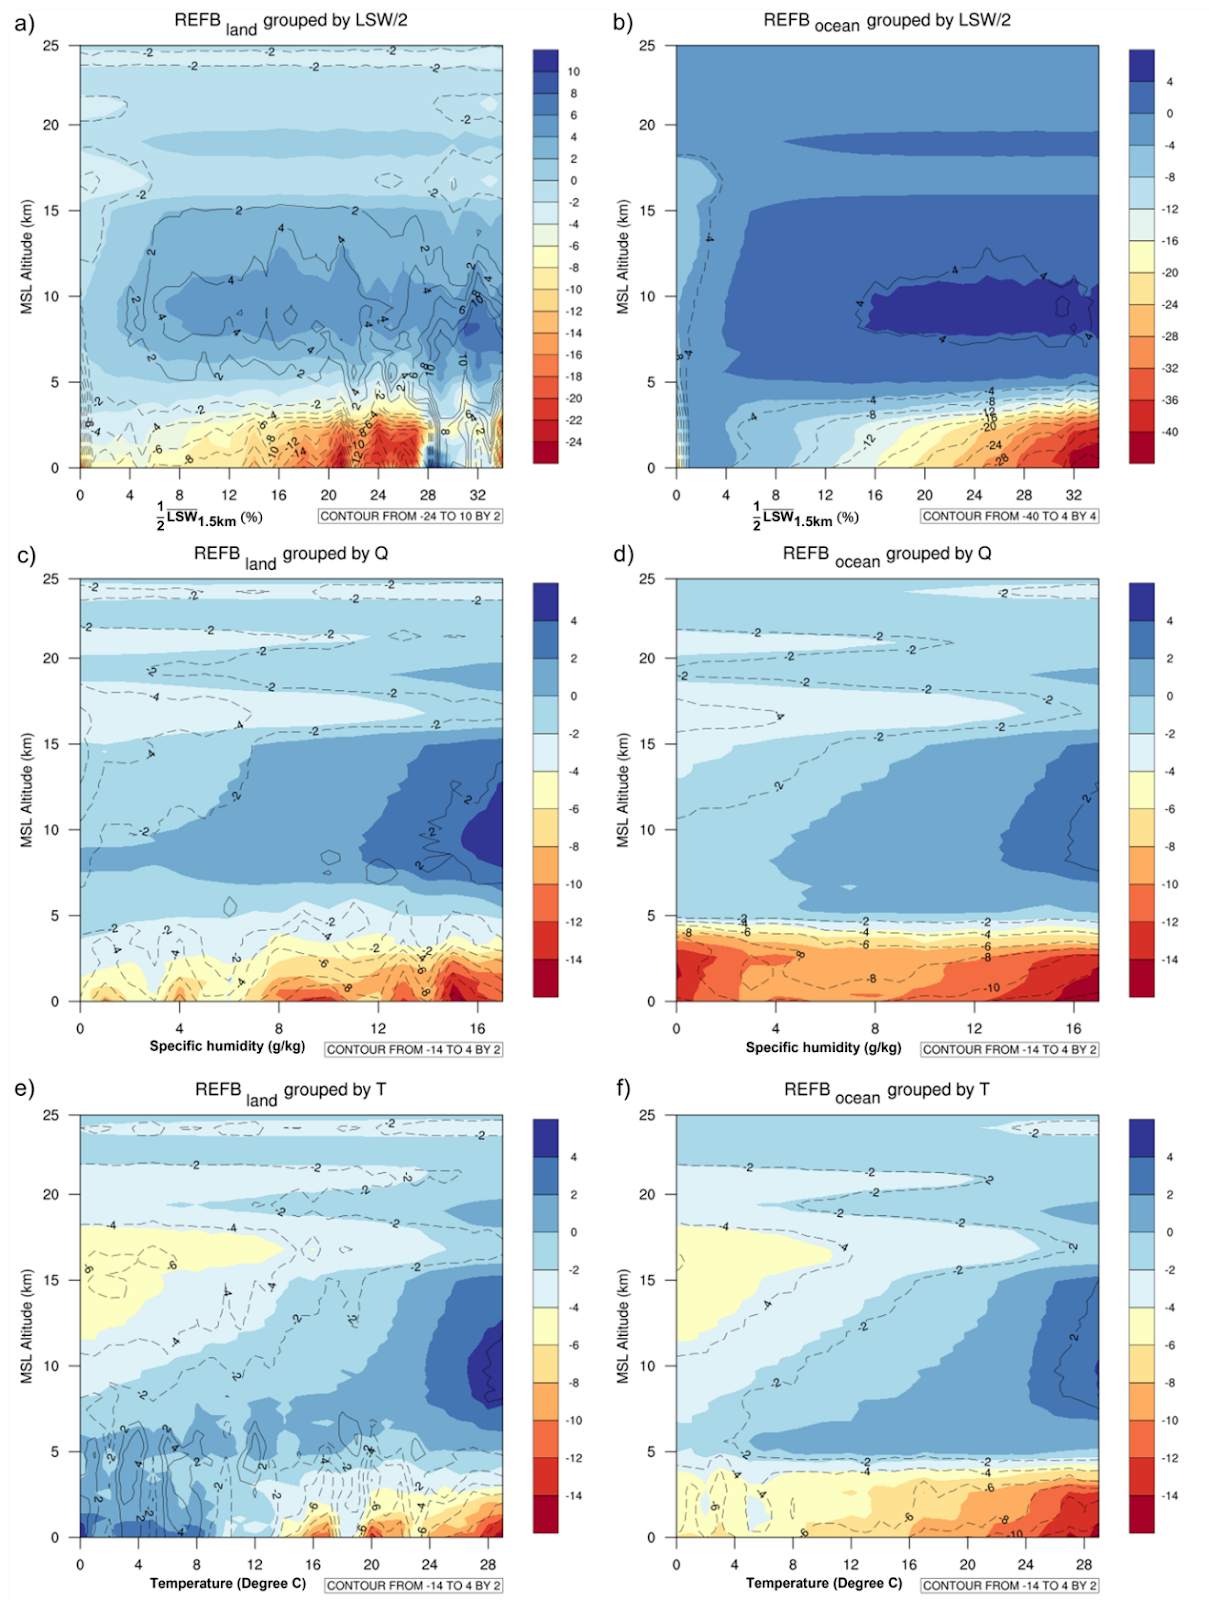
Figure 1: Refractivity bias as a function of height and average values over the lowest 1.5 km above MSL of (a) LSW/2, (c) specific humidity and (e) temperature over land. (b), (d) and (f) are the same as (a), (c) and (e), except over the ocean. The color shading shows the result using the RO profiles penetrating below 1.5 km while the contour uses the RO profiles penetrating below 0.5 km.
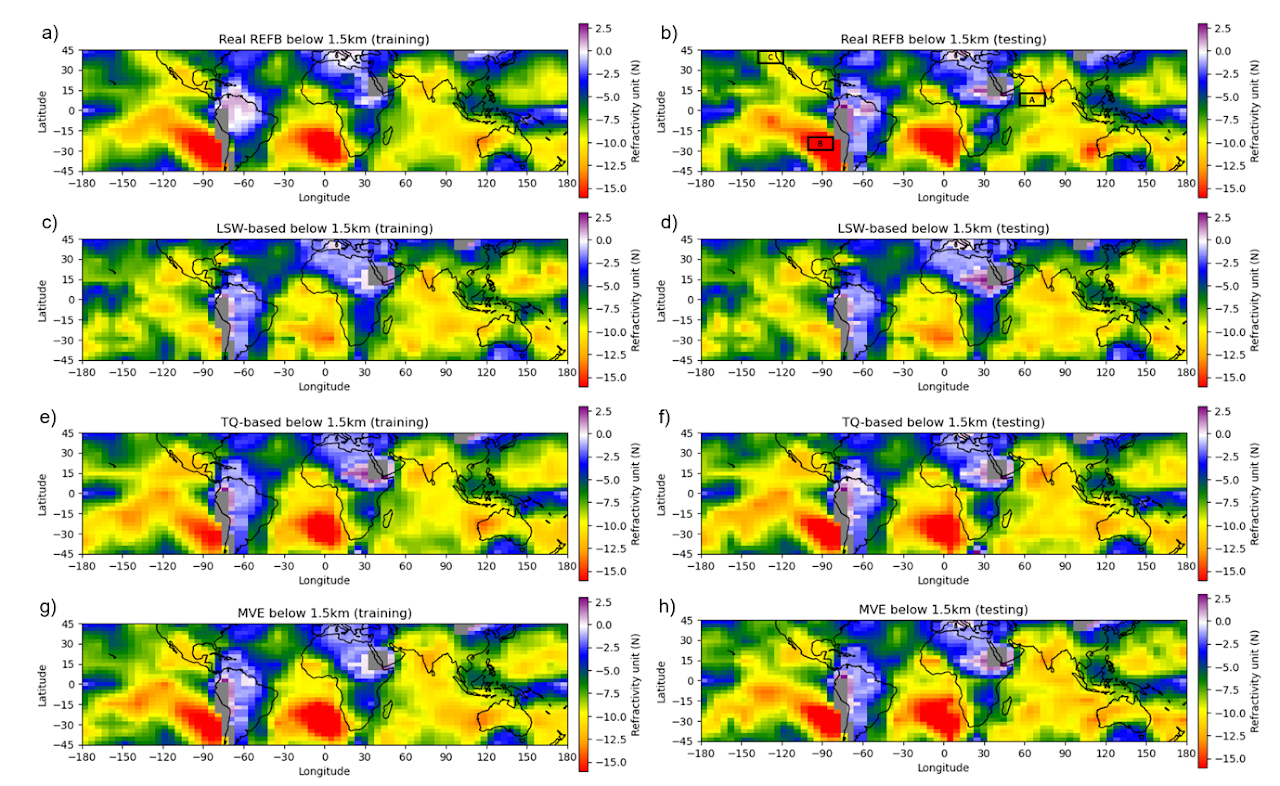
Figure 2: Horizontal distribution of refractivity bias and different estimated refractivity biases. All variables used to construct this figure are averaged below 1.5km. Area A is in the region of 0° < Lat < 10°N and 55°E < Lon <75°E, Area B is in the region of 20°S < Lat < 30°S and 105°W < Lon < 85°W, and Area C is in the region of 35°S < Lat < 45°S and 120°W < Lon < 135°W.